Explainable k-means Clustering
TL;DR: Explainable AI has gained a lot of interest in the last few years, but effective methods for unsupervised learning are scarce. And the rare methods that do exist do not have provable guarantees. We present a new algorithm for explainable clustering that is provably good for $k$-means clustering — the Iterative Mistake Minimization (IMM) algorithm. Specifically, we want to build a clustering defined by a small decision tree. Overall, this post summarizes our new paper: Explainable $k$-Means and $k$-Medians clustering.
Explainability: why?
Machine learning models are mostly “black box”. They give good results, but their reasoning is unclear. These days, machine learning is entering fields like healthcare (e.g., for a better understanding of Alzheimer’s Disease and Breast Cancer), transportation, or law. In these fields, quality is not the only objective. No matter how well a computer is making its predictions, we can’t even imagine blindly following computer’s suggestion. Can you imagine blindly medicating or performing a surgery on a patient just because a computer said so? Instead, it would be much better to provide insight into what parts of the data the algorithm used to make its prediction.
Tree-based explainable clustering
We study a prominent problem in unsupervised learning, $k$-means clustering. We are given a dataset, and the goal is to partition it to $k$ clusters such that the $k$-means cost is minimal. The cost of a clustering $C=(C^1,\ldots,C^k)$ is the sum of all points from their optimal centers, $mean(C^i)$:
\[cost(C)=\sum_{i=1}^k\sum_{x\in C^i} \lVert x-mean(C^i)\rVert ^2.\]
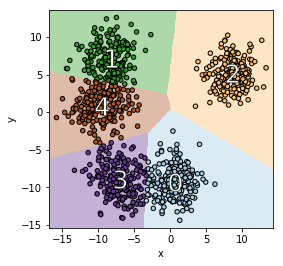
For any cluster, $C^i$, one possible explanation of this cluster is $mean(C^i)$. In a low-cost clustering, the center is close to its points, and they are close to each other. For example, see the next figure.
Unfortunately, this explanation is not as useful as it could be. The centers themselves may depend on all the data points and all the features in a complicated way. We instead aim to develop a clustering method that is explainable by design. To explain why a point is in a cluster, we will only need to look at small number of features, and we will just evaluate a threshold for each feature one by one. This allows us to extract information about which features cause a point to go to one cluster compared to another. This method also means that we can derive an explanation that does not depend on the centers.
More formally, at each step we test if $x_i\leq \theta$ or not, for some feature $i$ and threshold $\theta$. We call this test a split. According to the test’s result, we decide on the next step. In the end, the algorithm returns the cluster identity. This procedure is exactly a decision tree where the leaves correspond to clusters.
Importantly, for the tree to be explainable it should be small. The smallest decision tree has $k$ leaves since each cluster must appear in at least one leaf. We call a clustering defined by a decision tree with $k$ leaves a tree-based explainable clustering. See the next tree for an illustration.
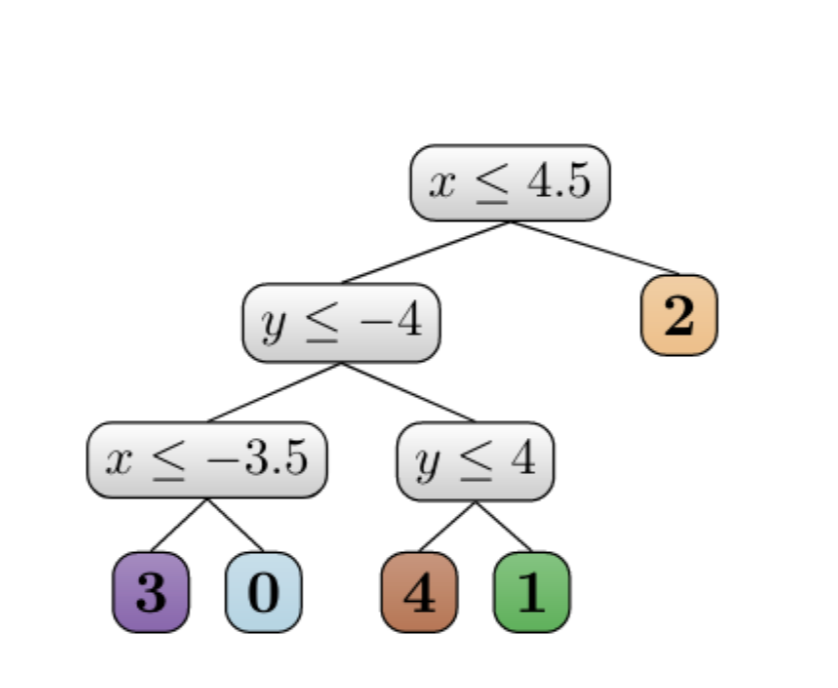
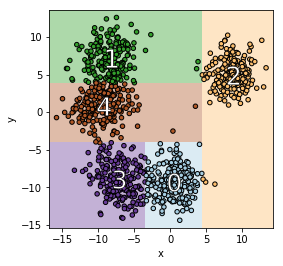
On the left, we see a decision tree that defines a clustering with $5$ clusters. On the right, we see the geometric representation of this decision tree. We see that the decision tree imposes a partition to $5$ clusters aligned to the axis. The clustering looks close to the optimal clustering that we started with. Which is great. But can we do it for all datasets? How?
Several algorithms are trying to find a tree-based explainable clustering like CLTree and CUBT. But we are the first to give formal guarantees. We first need to define the quality of an algorithm. It’s common that unsupervised learning problems are NP-hard. Clustering is no exception. So it is common to settle for an approximated solution. A bit more formal, an algorithm that returns a tree-based clustering $T$ is an $a$-approximation if $cost(T)\leq a\cdot cost(opt),$ where $opt$ is the clustering that minimizes the $k$-means cost.
General scheme
Many supervised learning algorithms learn a decision tree, can we use one of them here? Yes, after we transform the problem into a supervised learning problem! How might you ask? We can use any clustering algorithm that will return a good, but not explainable clustering. This will form the labeling. Next, we can use a supervised algorithm that learns a decision tree. Let’s summarize these three steps:
- Find a clustering using some clustering algorithm
- Label each example according to its cluster
- Call a supervised algorithm that learns a decision tree
Which algorithm can we use in step 3? Maybe the popular ID3 algorithm?
Can we use the ID3 algorithm?
Short answer: no.
One might hope that in step 3, in the previous scheme, the known ID3 algorithm can be used (or one of its variants like C4.5). We will show that this does not work. There are datasets where ID3 will perform poorly. Here is an example:
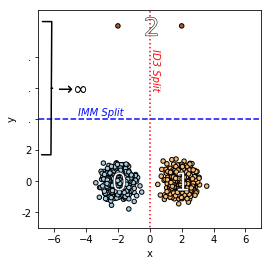
The dataset is composed of three clusters, as you can see in the figure above. Two large clusters (0 and 1 in the figure) have centers (-2, 0) and (2, 0) accordingly and small noise. The third cluster (2 in the figure) is composed of only two points that are very, very (very) far away from clusters 0 and 1. Given these data, ID3 will prefer to maximize the information gain and split between clusters 0 and 1. Recall that the final tree has only three leaves. This means that in the final tree, one point in cluster 2 must be with cluster 0 or cluster 1. Thus the cost is enormous. To solve this problem, we design a new algorithm called Iterative Mistake Minimization (IMM).
IMM algorithm for explainable clustering
We learned that the ID3 algorithm cannot be used in step 3 at the general scheme. Before we give up on this scheme, can we use a different decision-tree algorithm? Well, since we wrote this post, you probably know the answer: there is such an algorithm, the IMM algorithm.
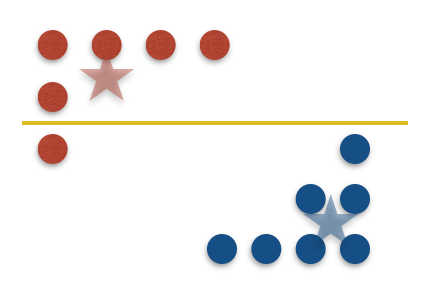
We build the tree greedily from top to bottom. Each step we take the split (i.e., feature and threshold) that minimizes a new parameter called a mistake. A point $x$ is a mistake for node $u$ if $x$ and its center $c(x)$ reached $u$ and then separated by $u$’s split. See the next figure for an example of a split with one mistake.
To summarize, the high-level description of the IMM algorithm:
find the split with minimal number of mistakes
Here is an illustration of the IMM algorithm. We use $k$-means++ with $k=5$ to find a clustering for our dataset. Each point is colored with its cluster label. At each node in the tree, we choose a split with a minimal number of mistakes. We stop where each of the $k=5$ centers is in its own leaf. This defines the explainable clustering on the left.
The algorithm is guaranteed to perform well. For any dataset. See the next theorem.
This theorem shows that we can always find a small tree, with $k$ leaves, such that the tree-based clustering is only $O(k^2)$ times worse in terms of the cost. IMM efficiently find this explainable clustering. Importantly, this approximation is independent of the dimension and the number of points. A proof for the case $k=2$ will appear in a follow-up post, and you can read the proof for general $k$ in the paper. Intuitively, we discovered that the number of mistakes is a good indicator for the $k$-means cost, and so, minimizing the number of mistakes is an effective way to find a low-cost clustering.
Running Time
What is the running time of the IMM algorithm? With an efficient implementation, using dynamic programming, the running time is $O(kdn\log(n)).$ Why? For each of the $k-1$ inner nodes and each of the $d$ features, we can find the split that minimizes the number of mistakes for this node and feature, in time $O(n\log(n)).$
For $2$-means one can do better than running IMM: going over all possible $(n-1)d$ cuts and find the best one. The running time is $O(nd^2+nd\log(n))$.
Results Summary
In each cell in the following table, we write the approximation factor. We want this value to be small for the upper bounds and large for the lower bounds. In $2$-medians, the upper and lower bounds are pretty tight, about $2$. But, there is a large gap for $k$-means and $k$-median: the lower bound is $\log(k)$, while the upper bound is $\mathsf{poly}(k)$.
| $k$-medians | $k$-means | |||
|---|---|---|---|---|
| $k=2$ | $k>2$ | $k=2$ | $k>2$ | |
| Lower | $2-\frac1d$ | $\Omega(\log k)$ | $3\left(1-\frac1d\right)^2$ | $\Omega(\log k)$ |
| Upper | $2$ | $O(k)$ | $4$ | $O(k^2)$ |
What’s next
- IMM exhibits excellent results in practice on many datasets, see this. It’s running time is comparable to KMeans implemented in sklearn. We implemented the IMM algorithm, it’s here. Try it yourself.
- We plan to have several posts on explainable clusterings, here is the second in the series, stay tuned for more!
- In a follow-up work, we explore the tradeoff between explainability and accuracy. If we allow a slightly larger tree, can we get a lower cost? We introduce the ExKMC, “Expanding Explainable $k$-Means Clustering”, algorithm that builds on IMM.
- Found cool applications of IMM? Let us know!